FlowWright Dashboard Designer offers two types of dashboard widgets:
- Preconfigured functional widgets - functionality is already integrated into the widget; the only customization options are the header text and colors.
- Customizable widgets can be tailored to display data based on a SQL query or a configuration, and they render the data within the widget. Additionally, header text and colors can be modified.
Example of a preconfigured widget:
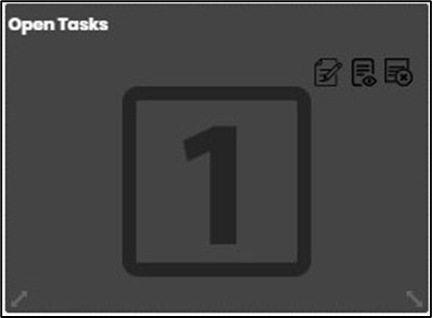
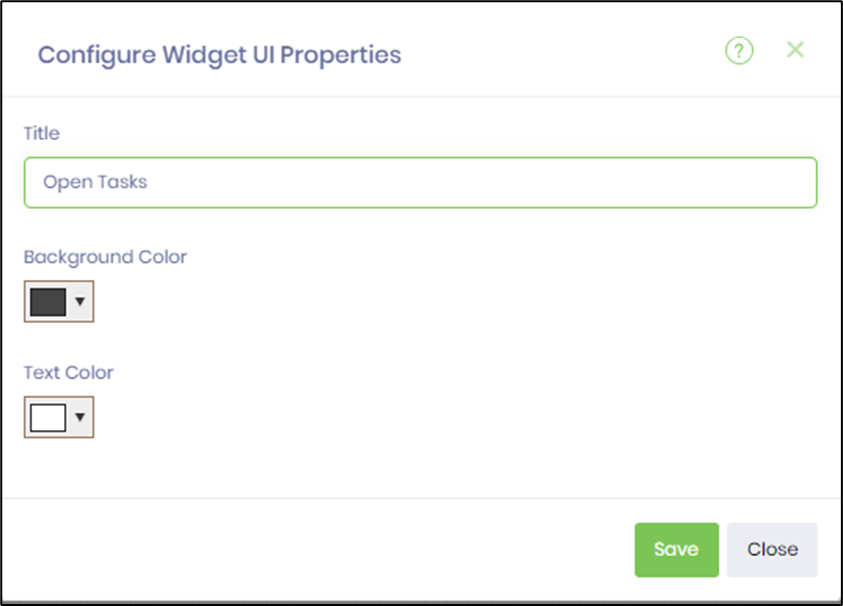
The above widget, by default, displays the number of open tasks for the current user. It only allows the following configurations:
Example of a Configurable widget:
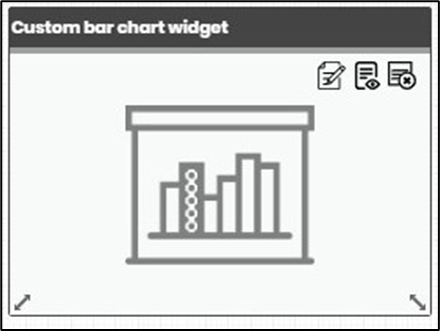
The custom bar chart widget lets the user connect to a database and set up an SQL query to display a graph based on the query results. The widget's configuration includes selecting the database connection from a dropdown list, entering a SELECT SQL query in the input field, specifying the date filter column, saving the changes, and previewing the dashboard.

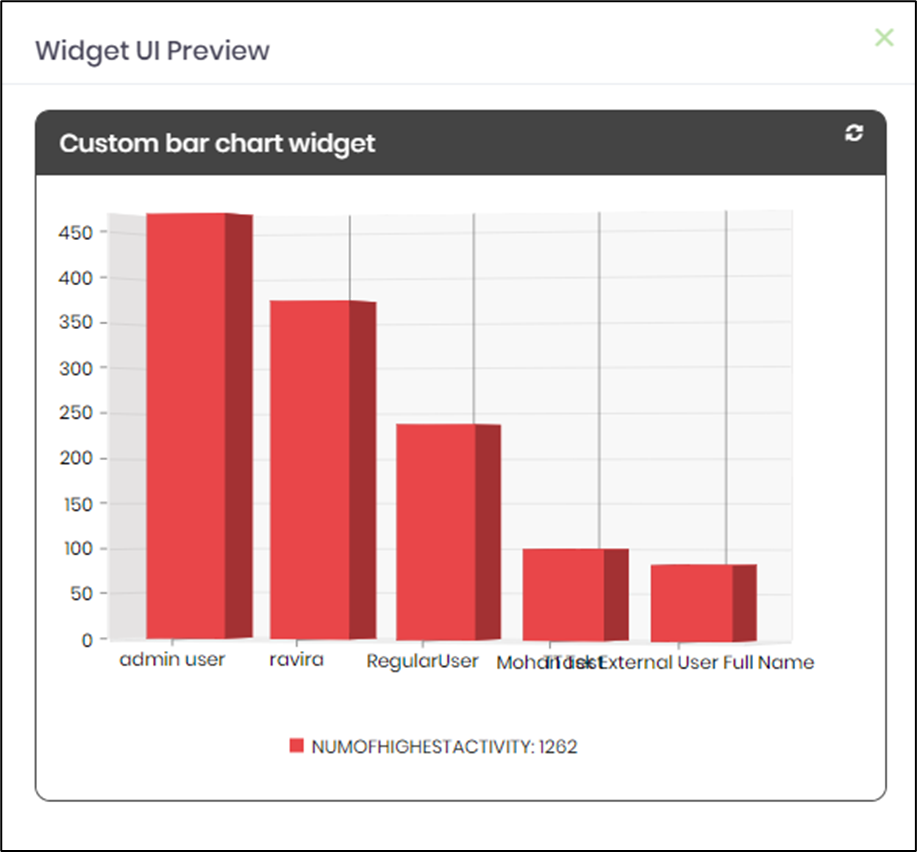
The dashboard is shown below (for reference).

Let's say we want the graph to display the top 5 users with the most activity from FlowWright as a bar chart. Then, you can select an existing connection to the FlowWright database; if there isn't one, create it and select it.
Enter the following SQL statement for the SQL query input field:
SELECT TOP 5 U.deExternalUserFullName as Name, COUNT(H.entryID) AS numOfHighestActivity
FROM deItemHistory H INNER JOIN deUsers U ON U.deUserID=H.itemID
GROUP BY H.itemID,U.deExternalUserFullName ORDER BY numOfHighestActivity DESC
Click the "Save" button to save the configuration. Click the preview icon on the widget to preview the pie chart. Preview should display the following: