This sample illustrates how to create a new dashboard bar chart widget, configure it using the Configuration Manager, add it to a dashboard designer, and display it in the dashboard.

Start Microsoft Visual Studio 2022 and select “New Project.” Select “C#” as the language and select “Class Library” as the project type. This example uses C# as the development language. This same example can also be written using Visual Basic.NET.
For the name of the project, provide “TestCustomBarChartWidget.”

Once the project is created, select “Class1.cs” and rename the class to “clsTestItemActivity.cs.”

The class is renamed to “clsTestItemActivity.cs.”

Right-click References under TestCustomBarChartWidget Project. Click Add Reference…

The reference manager window will open. Click the browse button.

Add a reference to FlowWright and navigate to the following directory: “C:\FlowWright.” Select the file “FlowWright.Engine.dll.”

Add a using statement: FlowWright.Engine

Let’s start building the class; first, implement the interface called: “deBarChartWidget.” We need to implement the “getData” method to fulfill the interface requirements. The getData method will return the clsBarChartWidgetReturn object. clsBarChartWidgetReturn has an oSeries property. The oSeries property returns List<deBarChartSeries>. Each deBarchartSeries object in the list indicates a series in the bar chart. deBarchartSeries has four properties: label, which is used as the series name; color, which applies color to the bar corresponding to the series bars; and bars property, which accepts the instance of the Bar class, which has order property, which shows the bars in assigned order, and data property, which contains actual data for the series.


Usually, bar charts are used to compare the relations between different data groups. We use data on the x-axis, and on the y-axis, we use count, representing the number of items created and updated.
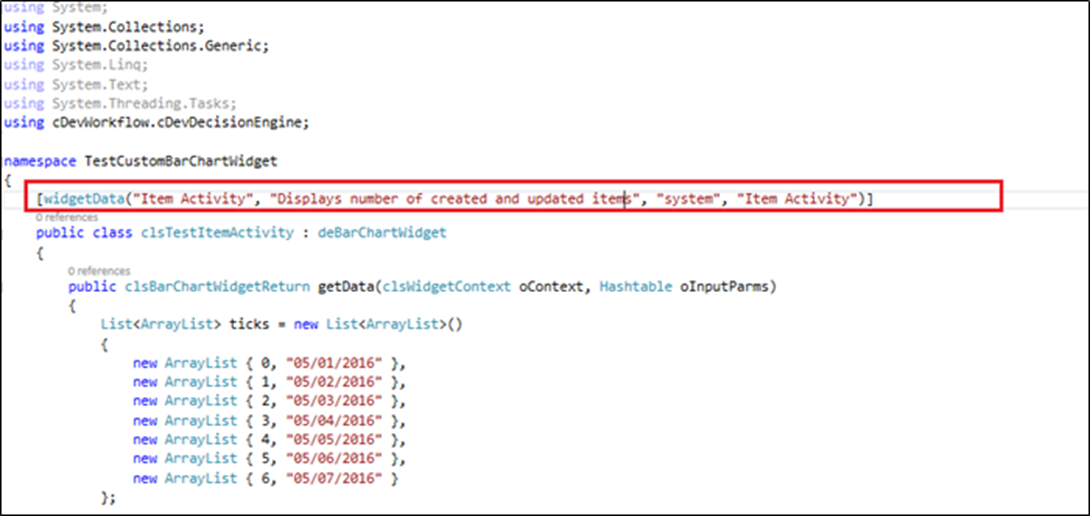
First, we need to create a dictionary of tick labels. In this example, we specify the x-axis data with serial numbers starting from 0. For the y-axis, we enter the value shown in the label. Additionally, we include the date.
After finishing with the ticks, we can assign the ticks to


Add the widgetData attribute above the “clsTestItemActivity” class. The attribute accepts four parameters. The first parameter will be the widget name. The second parameter agrees with the widget description. The third parameter will be the widget category. The fourth parameter is the widget display name.
Using the widgetData attribute, we could automatically configure the widget in the configuration manager.
Navigate to the directory where the DLL was compiled and select the DLL: “TestCustomBarChartWidget.dll.” Right-click on the file and select “Copy” from the context menu.

Copy the widget dll to the following directory: “C:\FlowWright”.

You'll need to navigate to the Administration - Dashboards Widgets page.
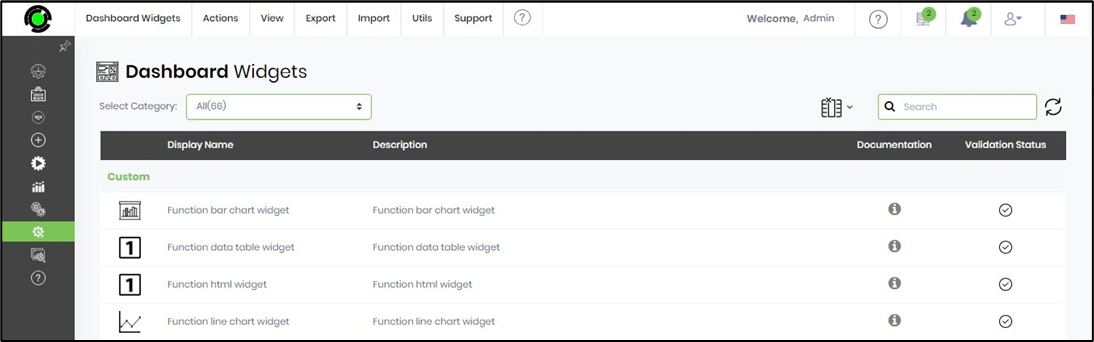
Click the Auto Detect option in the widget Definitions toolbar.
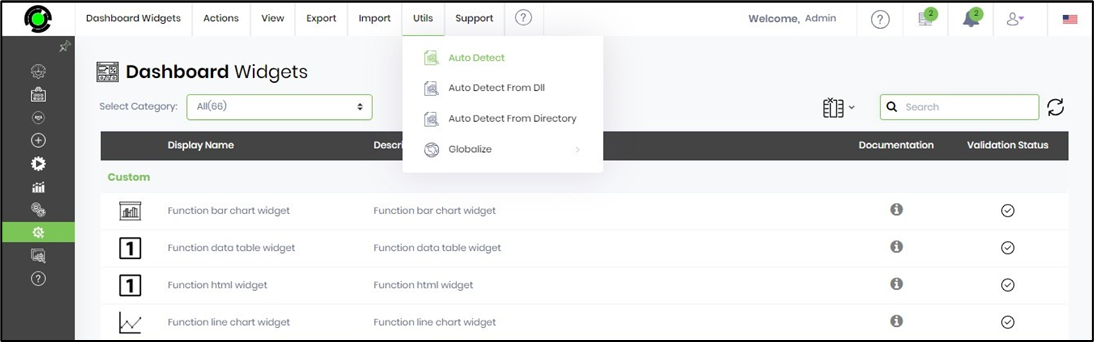
A new tab will open, which displays the list of widgets to configure.

Select the widget, and select the “Manage -> Configure” menu item.

Go to Manage Dashboards and select the “widgets” tab. Search for “item activity” (widget name) in the text box.
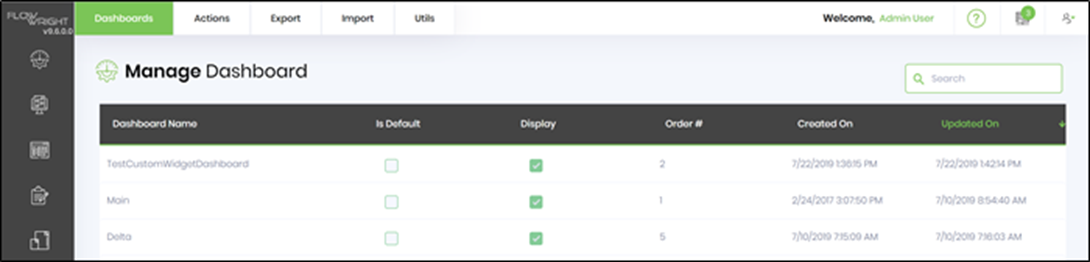
Now that the widget is fully configured, let's add it to a dashboard. Go to Manage Dashboards. Create a new dashboard called “TestCustomWidgetDashboard.” Enter the new dashboard name, select the layout, and click the “Create” button to create the dashboard.

A pop-up window is displayed for configuration. You must provide the Dashboard name and the order number for the position. Select the checkbox to open the designer page when creating. Click the Create button when ready.

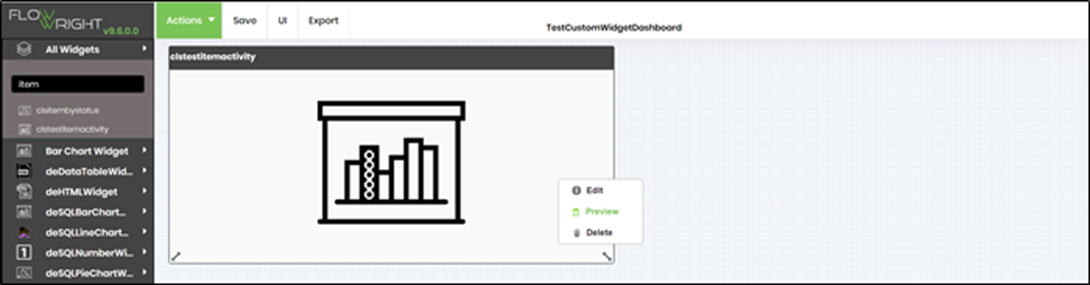
Once the new dashboard is created, the dashboard design will open as shown below:

Drag the “Item Activity” widget from the side toolbar and drop it into the placeholder in the right pane. Click Save, then preview the dashboard.

You can go to the dashboard designer, right-click on the widget, and click edit. A modal window will open to configure the widget's user interface.

Change the background and text color for the selected widget. Click save.

Right-click the widget and click Preview. A modal window will open, previewing the widget and the configured user interface.
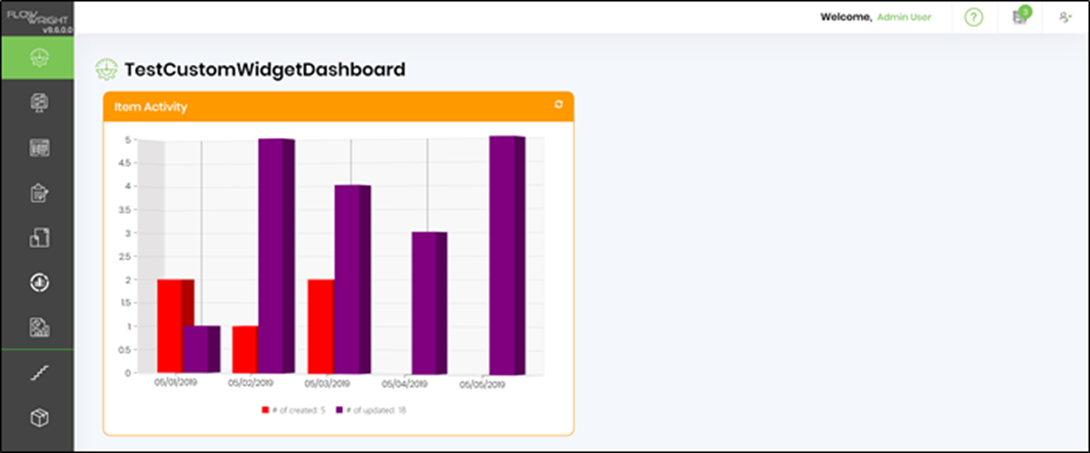
Click the Save and preview to render the dashboard.

Click the UI - Preview menu option.

The rendered dashboard looks as follows: