FlowWright supports complex expression evaluation and complex decision-making through steps and graphical representations.
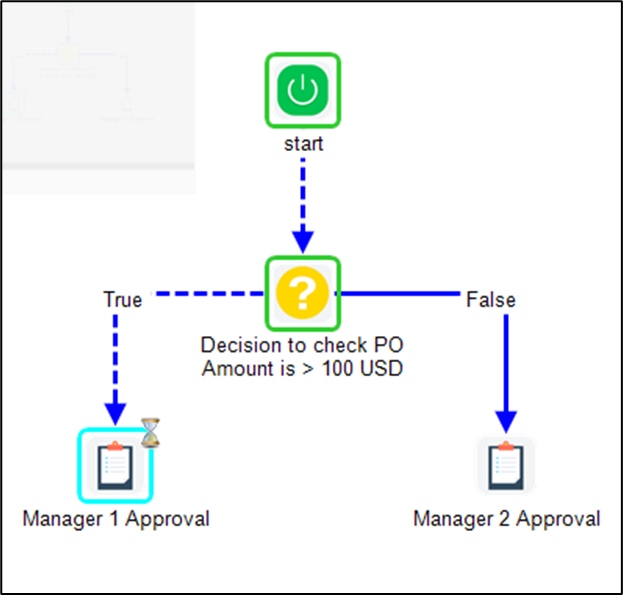
Here's a simple example, let's say your objective is to process purchase orders, based on the amount of the purchase order; if the amount is > $100 it is routed to Manager1 for approval, and everything else is sent to Manager2 for approval. This very simple approval example is based on a decision. Below is the graphical process definition:
Here's an executed view of the workflow instance:

You can graphically see what decision the workflow made, some purchase order amounts were passed into the workflow based on the amount and the expression then a decision was made to send the approval to Manager1. We have a more complex example of this, where our customers have many, many decisions in serial, parallel, nested, or multiple decisions evaluated. However the process is played out, you can graphically view what path the process took based on the graphical execution layout.
Graphical rules are a good way to view the execution but sometimes can get very messy when you go to modify or maintain them. These complex rules are also known to have dependencies. Another issue to consider is reusability; you can be used in a sub-workflow process and shared. This is where FlowWright Decision tables come in. Example: you are applying for a mortgage for a house, and banks have rule sets, or many expressions that determine what kind of mortgage that you qualify for. For example, your mortgage depends on the following inputs:
All the above inputs determine the outcome, which is the amount of mortgage that you qualify for. To determine the output, a rule set contains many rules with inputs and outputs. FlowWright Decision tables let you define and maintain rule sets, and use these rule sets in workflows. Workflow can provide inputs to the Decision table and get a result output or outputs from the Decision table. Decision tables let you share them across processes and can also be easily maintained in a single user interface.
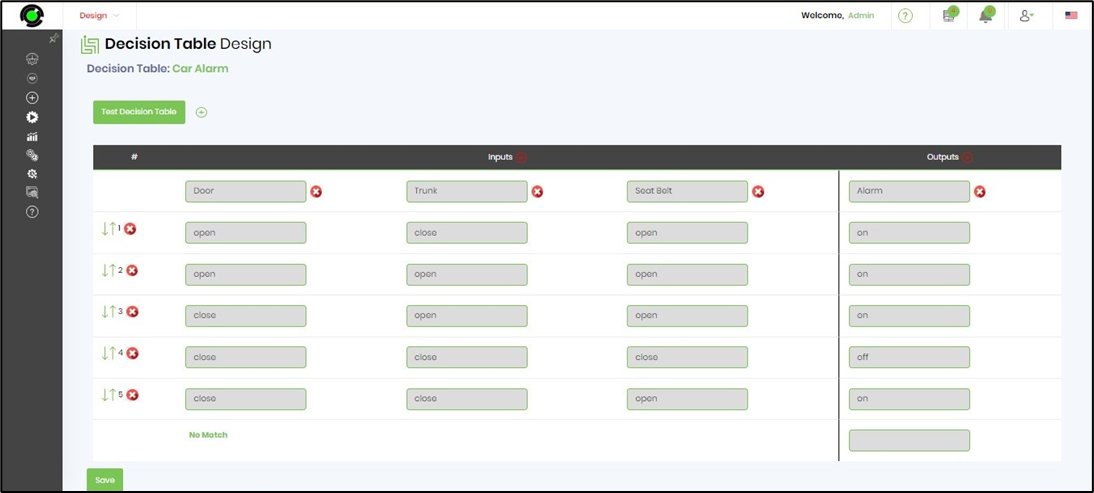
Here's a single example of a Decision table, where you want to know if the Car alarm is On or Off based on 3 inputs, those 3 inputs being the car door, trunk, and seat belt.

As you can see, based on the inputs provided, output defines the outcome. Any process can feed in the inputs and get the output. The main downside to Decision tables is that it becomes difficult to see what decision was made by the process, and what paths were taken by the process, the graphical view is condensed to be a single step.
Flow Wright provides both options so that our customers can make their choice whether to use graphical rules or decision tables.